Poker variance calculator
Hi
The variance calculator can show all possible variances from worst to best. It will show you your possible downswings in the distance.
I will use primedope.com calculator.

When you go to the site, you will be asked to provide values. Let's analyze each of them:
- Winrate in BB / 100. Win rate value in big blinds.
- Observed winrate in BB / 100 (optional). Observed win rate.
- Standard deviation (»?«) in BB / 100. Standard deviation. This indicator can be found in Holdem Manager 2 and is called "Std Dev bb per 100 hands".
- Number of hands to simulate. The simulation will run on the number of hands served. You can specify your number of hands played per month.
For example, I will indicate winrate 5bb / 100. I managed to create a graph like this.
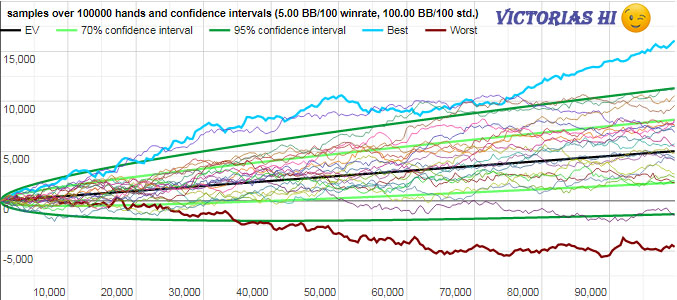
Let's take a look at what each line means:
- Black line (EV) - expected winnings at a distance.
- Dark green line - 95% confidence interval. The bright green line is the 70% confidence interval. These two lines show what kind of deviation from EV we can expect.
- Blue line - Best possible result.
- Burgundy line - Worst possible result.
In addition to the graph, they also provide a table that looks like this.
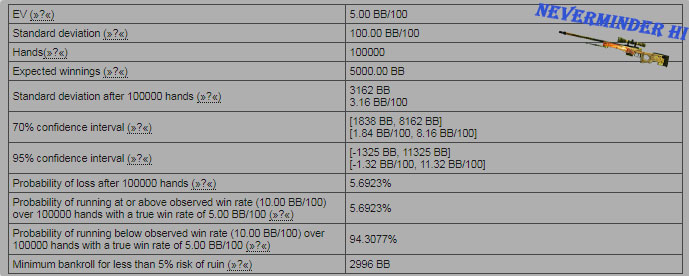
EV. The winrate we specified.
Standard deviation. Average deviation.
Hands. The table is compiled by the number of these tasks.
Expected winnings. Expected winnings.
Standard deviation after X hands. This indicator shows how much the difference in winrate can be at a given distance.
70% confidence interval. You are 70% likely to get these results.The first indicator is the minimum value. The second is the maximum value.
95% confidence interval. You are 95% likely to get these results. The first indicator is the minimum value. The second is the maximum value.
Probability of loss after X hands. The likelihood of remaining in the red.
Probability of running at or above observed win rate. Indicates whether your win rate will be similar to the Observed Win rate.
Probability of running below observed win rate. Indicates whether your win rate will be lower than the observed win rate.
Minimum bankroll for less than 5% risk of ruin. The minimum number of big blinds for the probability of losing a bankroll is less than 5%.
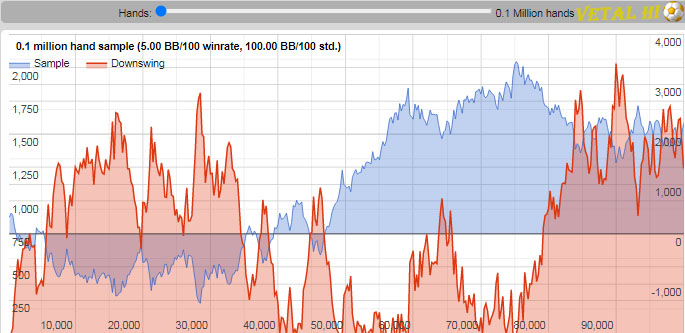
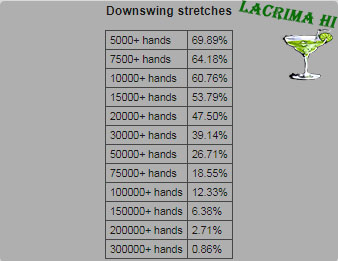
Also on the site we will be shown the possible drawdowns on the chart. It looks like this:
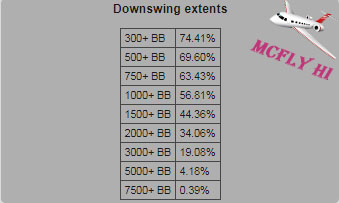
The information is also presented in a nicer table:


👍
👍
why did you forget about me?
4 photos, look carefully ;)
need a larger font
It was interactive for attentiveness)))